Jen Remnant, @JK_Remnant
We are over half way through the DISC project. The first phase of baseline data collection has concluded, though Abraham our PhD student is continuing with his fieldwork. The data we have collected is primarily what is called ‘qualitative’ data. Unlike ‘quantitative’ data, which is numerical, we were looking to find out people’s lived experiences of making academic careers more inclusive, their opinions and their personal examples. These aspects of human experience are challenging to quantify. Other data for the project is ethnographic, which is the recording of our experience as researchers conducting this work. This data is usually generated through note taking.
Most of our data is interview based. Project interviews, conducted with a collection of university staff (including research leaders, managers, human resources and estates staff, and trade union representatives), have taken between 20 minutes and an hour. They were digitally recorded, transcribed and anonymised before being uploaded to a qualitative data management programme called NVivo. We also uploaded Scottish University policies to NVivo, and pilot DISC data (interviews with disabled academics). The experiences of disabled colleagues, research leaders and professional services staff at Scottish Universities were compared with institutional policies. This comparison enabled us to reflect on the interaction individuals have with policies and university systems either in managing a disabled employee, or as a disabled person themselves.
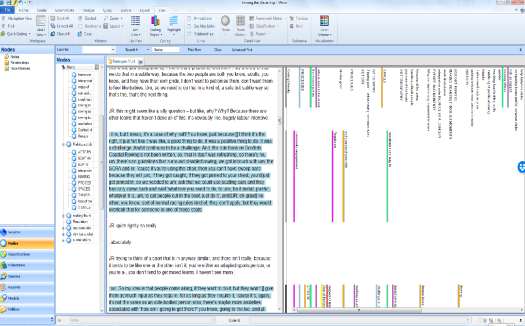
In exploring these working relationships we have generated themes and sub-themes arising from the data. The below picture shows how this looks in practice. Using NVivo we can see which themes overlap, and so consider identified issues in combination, and consider why they might be connected. For example, line manager decision-making and reasonable adjustments overlapped considerably – highlighting the managerial responsibility for implementing workplace accommodations for their employees.

There are numerous systems for this analysis. I favour ‘lumping and dumping’. This refers to reading through the data, highlighting chunks of text and putting them into specific ‘themes’ before completing a more nuanced analysis within that wider theme. I like to do this because it means I get an ‘at a glance’ sense of which themes are well-represented in the data, and which ones aren’t. Some researchers prefer to go through in detail in the first instance, conducting line-by-line ‘coding’. Some choose to do the entire process digitally, and others entirely by hand. The commonality between the different approaches to analysis are that they involve regularly revisiting the original data, and go through many iterative stages.
From this organised and coded data, we have been able to structure journal papers for academic audiences and tailor our developing training for specific audiences. This iterative and reflexive development has ensured that all the outputs from this project are data led and current, benefiting the efficacy of the training we are developing. We are now in the processes of building the training programme including the virtual reality components, with the intention to begin piloting before Christmas.
Thank you to everyone who has supported the work so far and we look forward to sharing more of our research over the next few months
Suggested further reading
- Bell, E., Bryman, A. and Harley, B., 2018. Business research methods. Oxford university press.
- Bryman, A., 2016. Social research methods. Oxford university press.
- Clarke, V., Braun, V. and Hayfield, N., 2015. Thematic analysis. Qualitative psychology: A practical guide to research methods, pp.222-248.
- Easterby-Smith, M., Thorpe, R. and Jackson, P.R., 2012. Management research. Sage.
- King, N., 2012. Doing template analysis. Qualitative organizational research: Core methods and current challenges, 426, pp.77-101.
